2017 House of Delegates Preview: Lifecycle of a Motion

PT Think Tank is proud to announce that over the coming weeks leading up to the NEXT Conference and the annual House of Delegates meeting, we will be covering all proposed motions in detail. These motions by nature are complex and have taken enormous amounts of effort and time from the authors and the Reference Committee to compile. Our goal is to provide insight and high-quality background information to these motions and begin a conversation about how these motions if accepted, could change our everyday practice of Physical Therapy. In order to effectively understand the motions that are being presented for the 2017 HOD, we must first understand how motions are developed, organized, and presented.

According to the APTA, all motions other than bylaw amendments, serve one of four major purposes. They define a course of action (policy), a stance (position), a binding statement to judge the quality of action (standards), or clearly state a goal the APTA wishes to achieve. Motions are vetted, researched, and revised over the course of a one or two year cycle, which typically revolves around the HOD meeting at APTA Next in June. Some more complex motions may take up to 2 years of research and refinement prior to being introduced to the House. The APTA has identified 3 major phases of the motion lifespan: Conception, Development, and Presentation.
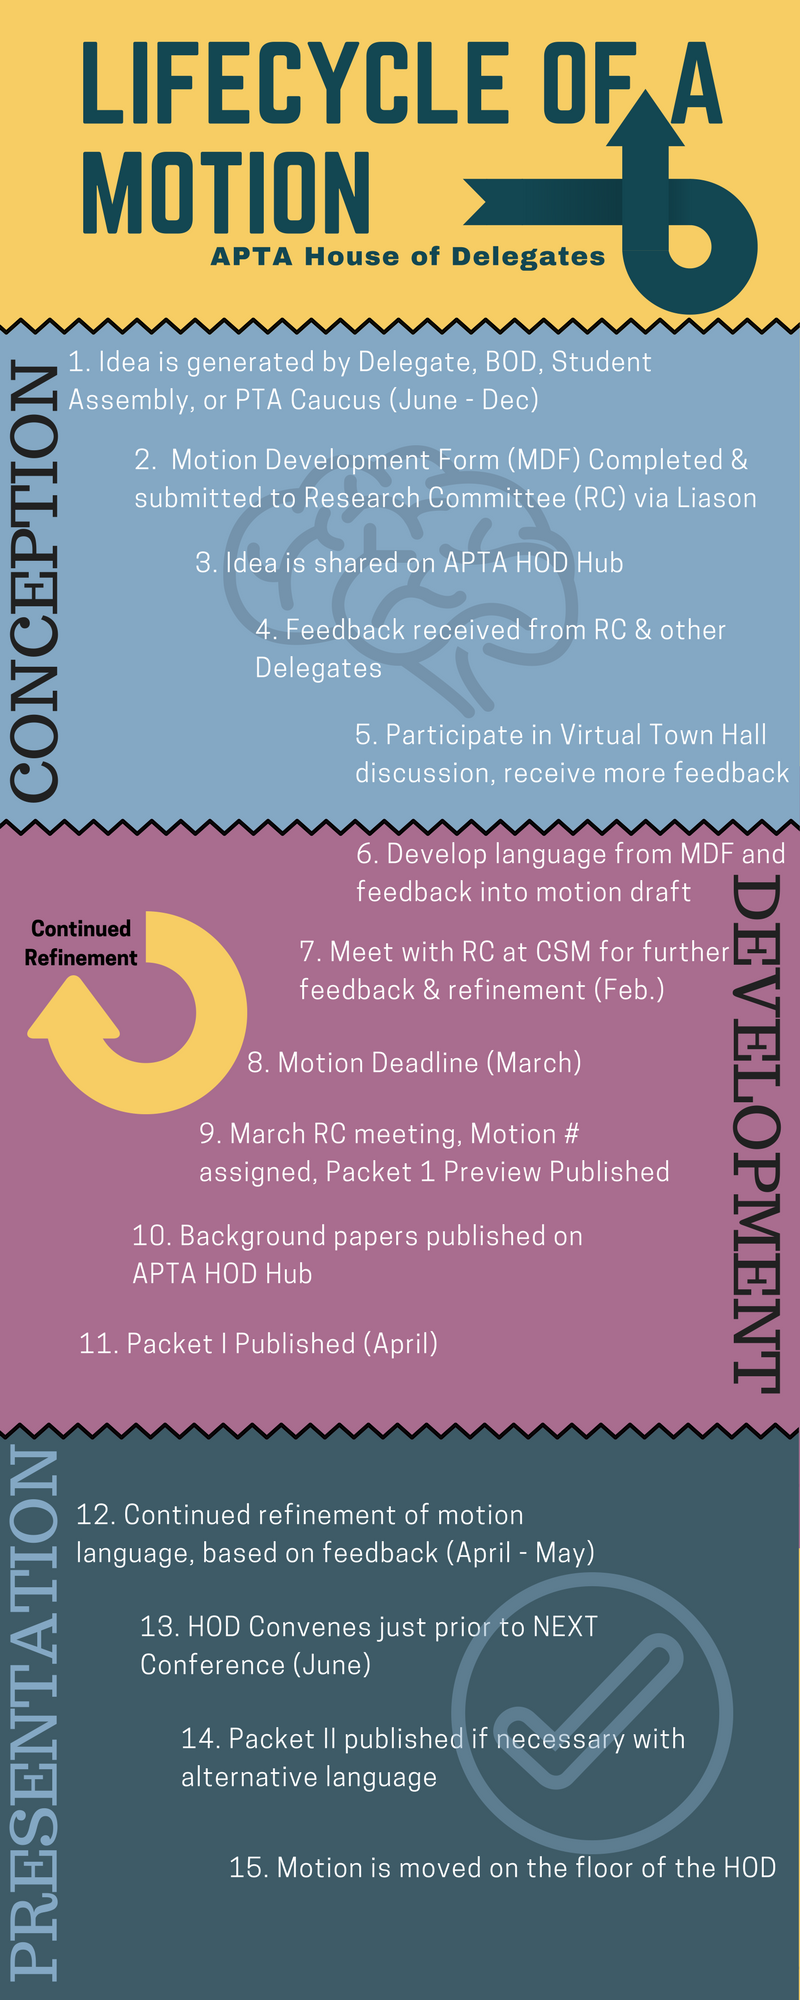
Lifecycle of a Motion Infographic

So what does the Reference Committee do, and how many motions are introduced every year? According to Dr. Michael Pagliarulo, PT, MA, EdD, Member and former Chair of the RC, roughly 20-30 motions come before the HOD each year, but that number is decreasing as a result of considering issues of more significant impact on the profession and society.  The RC’s job is not to research these motions, but to assist the delegates in the motion development process. They provide advice and counsel to the delegates on form, wording, and method of motion presentation – helping the delegates clearly state motion’s intent. This is a complex process and the RC provides the guidance necessary to the authors so it can run as smoothly as possible. And running smoothly is extremely important in this process, as Dr. Pagliarulo explains what happens once the motion is moved:

“Once motions are moved, seconded, and announced by the speaker, they become the property of the voting body. That body then debates that motion and can then vote to adopt or defeat.  Amendments are also in order during the debate.  The amendment can also be amended.  Then you must go backwards to vote on the amendments.  Once they are dispensed, other amendments are in order, and they must be voted on.  Once the body has exhausted amending the main motion, then the main motion is voted on as amended, if any of them had been adopted.  To make matters even more exciting, there are other types of motions that could occur during the debate. For example, the motion could be referred to the Board of Directors for further consideration, or postponed definitely to be considered after interested parties had an opportunity to meet and reach consensus on issues, or postponed indefinitely, which essentially defeats the motion.  There are even other types of motions, but these are the main ones. This is why we always have a parliamentarian present at the House to help us get through some complex strategies.”


Got it? Good! Starting May 11, we will report on each of the motions that will be coming before the HOD in June. Stay tuned!


Resources:

PT Think Tank would like to sincerely thank Dr. Michael Pagliarulo for his assistance in this project.

2017 Packet I can be found here.

2017 Background Papers can be found here.

Helpful Webinars (Free to APTA members!):

CSM Inside the Numbers

Busy Crowd

If you were at CSM in San Antonio last week, you know this conference was big – in a variety of ways. The APTA touted record attendance levels. The conference was spread out among a huge convention center, with concurrent sessions in two additional hotel centers. Overflow viewing screens had to be set up in the hallways to accommodate full sessions. The exhibit hall was sold out and always packed. The conference hashtag, #APTACSM was even trending at the #2 spot on Twitter for some time. I guess everything really is bigger in Texas. Let’s investigate the growth of this conference, and who actually attends.

CSM 2017 continued to set attendance records this year and has been growing steadily in popularity in the profession. Reports of total attendance have varied for the conference, with talk of over 14,000 in San Antonio. Erin Wendel-Ritter, Manager of Media Relations and Consumer Communications for the APTA, reported registration was over 11,600* for conference attendees. That is a lot of PTs, PTAs, and SPTs! While the number itself is impressive, how does it break down to actual membership? Dr. Sharon Dunn, President of the APTA, tweeted that the Association is at ~98,000 members, with a drive to get to 100k by the NEXT Conference in June. That equates to roughly 11.8% of members attending CSM. There are a variety of reasons why members do not attend yearly conferences, including registration cost, travel, and time off work.

I think we can be more involved as a profession – 11.8% is good, but we can most certainly do better. As Dr. Dunn notes, it starts with increasing the membership of the APTA. Even if we stay at 11-12% attendance, an annual increase in membership of 3% would increase the attendance by roughly 1,000 registrants in 2018. This is no small task, as the rates of membership among other national healthcare organizations, such as the AMA, have suffered recent setbacks in membership rates. From an overall profession standpoint, in 2014 the Bureau of Labor Statistics reported that our profession encompassed around 292,130 Physical Therapists and Physical Therapist Assistants. From that point of view, CSM draws only about 4% of Physical Therapy professionals to attend. And that does not include students.

The student attendance at CSM 2017 was staggering. At times, it almost seemed like a student conference. Erin reported that student registrants accounted for over 4,100* of the total attendees! Student attendance was 35% of the total conference attendance. I think this is great – sort of. CSM is obviously doing a great job of attracting young professionals to a growing conference. Hopefully, they realize the value in the education and networking opportunities and continue to attend as professionals. Students are the future of our profession, and our profession is arguably the future of healthcare. The downside, however, is that it knocks down the number of actual practicing PTs that are attending this conference. If we take students out of the equation, then only about 7,500 practicing PTs and PTAs were in attendance or about 2.5% of the actual PT workforce.

So where do we go from here? The obvious answer is to encourage membership and active participation in the APTA. We can learn a lesson here from the AMA as well, their membership has started to increase in 2015 after a decade-long decline. How did they do it? By attracting student members and becoming more involved with academic institutions. Another solution is to continue to encourage PT professionals to share their voice on social media, which may create FOMO for those not in attendance. I expect students will continue to play a huge role in the development and growth of CSM as a conference in the years to come, and I hope that they continue to be active as graduate Physical Therapists.

*Initial numbers reported to PT Think Tank at the time of publishing. Final attendance numbers will be released on 3/6/17, at which time this article will be updated.

Physical Therapy Metrics

With the widespread use of EMR, more and more data is being collected about the way we practice. A recent post on the Four Hour Work Week by Eric Ries, has me thinking about metrics, specifically PT metrics and how they relate to the care I provide, and the experience my patients have. Eric breaks business metrics down into two types: vanity metrics and action metrics. Vanity metrics is the data that “might make you feel good, but they don’t offer clear guidance for what to do.” On the other hand, action metrics help us make decisions and give us valuable information about our practice. Traditionally metrics in the PT world can generally be broken down into 3 categories: billing, productivity, and referral metrics. More specifically, lets explore how vanity and action metrics relate back to individual (not company wide) practice.

Vanity Metrics: Private practice owners might argue that “no data is bad data” when it comes to tracking patients and therapist performance in the clinic. However, some data points simply do not provide an accurate picture of individual therapist performance, and could be better suited when applied to company performance, or ignored altogether.

  • Visits per case/referral: In my opinion, this data set is the most inconclusive of all metrics commonly tracked to individual PTs in EMR programs. The general rule-of-thumb for most private practices is that the visits per referral number should be between 10-12. This depends on several factors: skill level of therapists; number of post-operative referrals, geographic location, patient population/SES, referral source, clinic reputation, and the list goes on and on. I have found this metric has no bearing on patient outcomes, or patient/physician satisfaction. If you can obtain the same outcomes in 6-8 visits versus 10-12, your patients will be happier, and your referral sources will be impressed. In return, you see a higher volume of new evaluations – which means more and more happy patients.
  • Incomplete metrics: Other metrics that are commonly applied to individual PTs are actually “incomplete,” or too variable to apply to individual performance. For example, scheduling related metrics, such as cancellation and no-show rates, are mostly out of the control of the therapist and do not reflect on the quality of care provided. Obviously, a good clinician that creates buy-in, demonstrates value, and has good outcomes will generally have a low cancel rate. But, cancellation rate does not always reflect productivity – a clinician with a cancellation rate of 4% does not mean they are more effective than a therapist with a cancellation rate of 10% – this variation could easily be due to scheduling, clinic hours, weather, traffic, or an entire host of other variables.

Action Metrics: Action metrics are the data that should be used to evaluate therapist performance and patient outcomes. These metrics help the decision making process, and can demonstrate value to your referral sources and the general public.

  • Plan of Care (POC) complete to Discharge: Perhaps the most under-tracked, but most important data point is patients who complete a POC to discharge. Generally this happens when appropriate care is provided (regardless of number of treatment sessions), goals are met, and functional limitations are eliminated. The therapist and the patient are on the same page, and the patient is happy with the care they receive. And happy patients produce more business – not only by word of mouth and leaving reviews online, but also by telling their physician about the quality of care they received. A high percentage in this metric indicates that the clinician provides quality care and communicates well with their patients.
  • Units/visit: Another metric that is highly variable depending on the patient population and insurance type, but useful nonetheless is units per visit. Tracking units/visit at the provider and company level is beneficial – this serves to make sure therapists are not under-billing; which is all too common in PT practice. It also allows therapists to make sure they are not over-billing, which may make you more susceptible to audits. This metric also allows for more accurate clinic budgeting and forecasting income.
  • FOMs: Tracking change by using functional outcome measures is critical to evaluating therapist performance and patient outcomes. Functional outcome measures should be used with every patient, every time. However, accuracy requires that valid measures are being used, and that measures are used with the correct patient population. Understanding MCID and MDC for each measure is also important. These metrics should also be used to support Functional Limitation Reporting. In addition, physicians and referral sources often use and understand these measures, easing the communication gap while marketing to potential referral sources.
  • New patients per therapist/requested therapist: Another under-tracked and under-utilized metric is new evaluations per therapist. Particularly, patients who request a therapist by name are often more satisfied with the care they receive and more likely to complete their recommended course of therapy. I find this number often correlates with patients who complete their POC to discharge, looping back into the cycle of happy patients and word of mouth referrals.

When extrapolated across a group of therapists in a company or clinic, action metrics provide a more meaningful picture of how valuable our services are. Individually, vanity metrics can be misleading and provide little value as to the value and productivity of a therapist.  Eric Reis encourages us to “measure what matters” – meaning that more data is not always better, and argues that the key to having actionable metrics is “having as few as possible.” It can be tempting with EMR to look at a seemingly endless set of metrics, but narrowing our focus on a few can provide better insight into therapist, clinic, and business performance. How do you use metrics in your clinic? Which ones are used to evaluate individual performance?

Medieval Therapy Techniques?

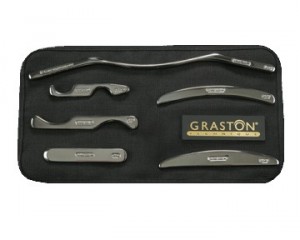
Graston ToolsDo PTs today practice medieval therapy techniques? An ABC affiliate in San Francisco seems to think we use medieval tools, anyway. The technique reported on is the Graston Technique,® an aggressive form of soft tissue mobilization aimed at breaking up adhesions between fascia and muscle fibers using specialized tools. In theory, this treatment is essentially the same as aggressive STM; the difference lies in the use of the specialized tools.

So do the tools really make the technique more effective than traditional STM? The literature results are extremely limited. Only one study directly compared STM and the Graston Technique ®:

Burke et al. compared Graston Techniques ® to regular STM provided by the therapist’s hands for the treatment of Carpal Tunnel Syndrome. They resulted no clinical differences between the two groups, but did substantiate the clinical efficacy of conservative treatment for mild to moderate CTS.

Perhaps the effectiveness of the Graston Technique ® occurs from the ability to detect adhesions better than manual palpation alone. Users report feeling vibrations or hearing clicks as they move the tools over adhesions that were not detected by palpation. There are a few case studies that report solely on the effectiveness of the Graston technique.

Hammer reports on the ability of the Graston Technique ® user to both feel and target treatment on areas of degenerated tissues in three cases involving plantar fasciitis, Achilles tendonosis, and supraspinatus tendonosis.

Aspergren et al. effectively used thoracic (HVLAT) manipulation and the Graston Technique ® to treat a collegiate volleyball player with acute costochondritis. Although the authors did not compare to thoracic manipulation plus manual STM, pain and functional levels improved.

Other foreseeable benefits include the ability to really dig-in during STM and saving your own joints as a PT, benefits that may also be found in simple massage tools. The side effects include being too painful for many patients and causing bruising in some patients. In all, more research needs to be performed comparing the technique to regular STM by independent examiners.

Bottom line: for now, trust in your hands – they have been around since before medieval times, and are the most powerful tool a PT possesses.

1. Burke J, Buchberger DJ, Carey-Loghmani MT, et al. A pilot study comparing two manual therapy interventions for carpal tunnel syndrome. J Manipulative Physiol Ther. 2007;30(1):50-61.

2. Hammer WI. The effect of mechanical load on degenerated soft tissue. J Bodyw Mov Ther. 2008;12(3):246-256.

3. Aspegren D, Hyde T, Miller M. Conservative treatment of a female collegiate volleyball player with costochondritis. J Manipulative Physiol Ther. 2007;30(4):321-325.

Integrating Tablet Computers Into Your Practice

iPad in use
Photo Courtesy Tom Raftery via flickr

With Mac releasing the iPad last week, it is time to think about how these new tablet computers that are flooding the market can become a valuable member of your PT team. But to many, abandoning your traditional pen and paper for a sleek touch-screen tablet computer seems overwhelming.

The potential for these devices to make your office more efficient is almost limitless. Combining tablets with electronic documentation (you are using electronic documentation, right?) could give you the opportunity to integrate information from multiple levels. Imagine having diagnostic images, the patient’s medical history, the PT chart, physician’s orders, and functional outcome measures all easily accessible on one, ½ inch thick screen. But, the benefits go beyond working in a paperless environment. Having the internet in your hands during treatment sessions allows you to browse special tests, diagnostic information, drug information, and more importantly patient education materials like instructional videos. You can also search for detox center in Orlando to overcome drug addiction as it has numerous negative impacts. Some tablets also feature 3G capabilities, allowing PTs in home healthcare the ability to access the same information available on a WiFi network. Ideally, this would result in the opportunity to be more efficient and spend more time treating and educating patients, not writing SOAP notes by hand, scheduling, or billing.

But, introducing these devices into your clinical practice is not for everyone. It is important to remember that no single device (not yet anyway!) is appropriate for all clinics or settings.  The potential is great for integrating these devices into PT practice, but is there an app for that? Since this technology is so new, the documentation software you prefer or the features you want may not be available yet. Cost may be another barrier to integration, ranging from $499 to $829, the iPad can be expensive, especially if you are integrating into a large clinic or hospital setting. Apple is not the only company on the tablet front, HP-Compaq, Dell, and Panasonic ToughBook all offer competing models. Compared to laptops, the current trend, tablets are easier to disinfect, less cumbersome, touch-screen, feature a longer battery life, and easier to operate overall.

These platforms also open the door for PT specific apps and programs to be developed. At an average of $1.99 per download, the apps for the iPad are more expensive than their iPhone counterparts. As PTs and the general public catch the app downloading bug, there is profit to be made in every sector, not just healthcare. The question then becomes, should PT specific apps be limited to PTs? And, if so, how do we regulate who downloads them?